Candlestick Charts


Candlestick Charts
Regular price
Checking stock...
Regular price
Checking stock...
Summary
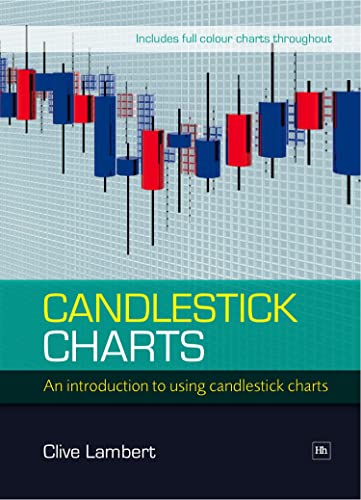
Candlesticks are a fantastic way of getting a clear idea of market direction, and any changes that may be taking place in price trends. This title intends to change the simple viewing of a candlestick chart into a search for the answer to the perennial question: 'Who's controlling the market; the Bulls or the Bears?'.
The feel-good place to buy books
- Free US shipping over $15
- Buying preloved emits 41% less CO2 than new
- Millions of affordable books
- Give your books a new home - sell them back to us!
Candlestick Charts by Clive Lambert
The aim of this book is to introduce candlestick analysis to anyone from an absolute beginner to an experienced market professional. The text is written to be simple enough for someone new to the topic, but should not exclude those with more experience. The author's aim is to change the simple viewing of a candlestick chart into a search for the answer to the perennial question: Who's controlling the market; the Bulls or the Bears? Candlesticks are a fantastic way of getting a clear idea of market direction, and any changes that may be taking place in price trends. In this exciting new book, Clive Lambert walks you through what candlesticks are, the major patterns and importantly, the psychology behind them, using straightforward language that will appeal to all levels of ability. Having outlined the key patterns and described the real-life application of the techniques, he then ends the book with his 10 golden rules for trading with candlesticks. This book is a no-nonsense guide to the methodology and practical usage of this ancient Japanese charting technique and essential reading for any trader, broker or market operative, regardless of their level of experience or the markets they are involved in.
Clive Lambert has been writing daily technical analysis for futures traders since 2000 as director of FuturesTechs. Previous to that he spent 12 years as a floor broker in the Stock Exchange and Futures markets. As a technical analyst he originally focused on financial futures, but thanks to the flexibility of candlestick charts has successfully translated his analysis into equities and commodities as well.He regularly speaks at seminars, and conducts training courses on technical analysis for several organisations, such as CME Group and 7 City Learning. He is an active board member of the UK Society of Technical Analysts. He has had articles published in various technical analysis publications, is regularly quoted on Dow Jones Newswires and Reuters, and appears on CNBC.
| SKU | Unavailable |
| ISBN 13 | 9781905641741 |
| ISBN 10 | 1905641745 |
| Title | Candlestick Charts |
| Author | Clive Lambert |
| Condition | Unavailable |
| Binding Type | Paperback |
| Publisher | Harriman House Publishing |
| Year published | 2009-01-30 |
| Number of pages | 175 |
| Cover note | Book picture is for illustrative purposes only, actual binding, cover or edition may vary. |
| Note | Unavailable |