


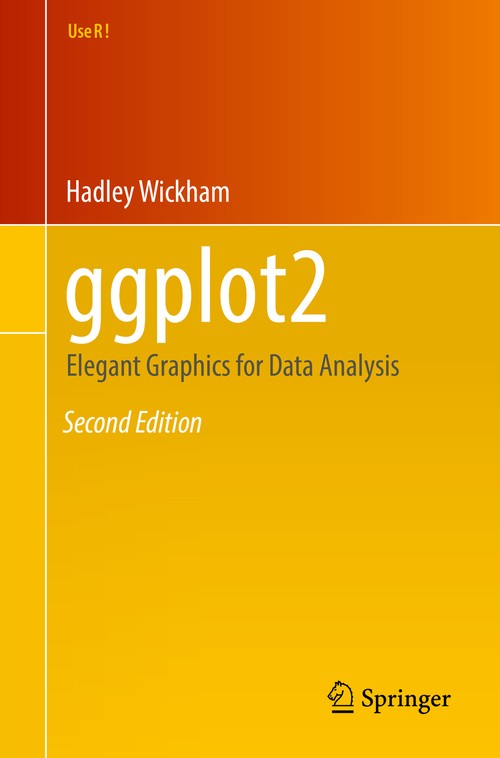
ggplot2 by Hadley Wickham
This new edition to the classic book by ggplot2 creator Hadley Wickham highlights compatibility with knitr and RStudio. ggplot2 is a data visualization package for R that helps users create data graphics, including those that are multi-layered, with ease. With ggplot2, it's easy to:
- produce handsome, publication-quality plots with automatic legends created from the plot specification
- superimpose multiple layers (points, lines, maps, tiles, box plots) from different data sources with automatically adjusted common scales
- add customizable smoothers that use powerful modeling capabilities of R, such as loess, linear models, generalized additive models, and robust regression
- save any ggplot2 plot (or part thereof) for later modification or reuse
- create custom themes that capture in-house or journal style requirements and that can easily be applied to multiple plots
- approach a graph from a visual perspective, thinking about how eachcomponent of the data is represented on the final plot
This book will be useful to everyone who has struggled with displaying data in an informative and attractive way. Some basic knowledge of R is necessary (e.g., importing data into R). ggplot2 is a mini-language specifically tailored for producing graphics, and you'll learn everything you need in the book. After reading this book you'll be able to produce graphics customized precisely for your problems, and you'll find it easy to get graphics out of your head and on to the screen or page.
-
 A Primer of Ecology with R
-
 Introductory Time Series with R
-
 Bayesian Networks in R
-
 A Users Guide to Network Analysis in R
-
 Bayesian Computation with R
-
 Biostatistics with R
-
 R For Marketing Research and Analytics
-
 Data Manipulation with R
-
 Applied Spatial Data Analysis with R
-
 R Coding for Ecology
-
 Bayesian Cost-Effectiveness Analysis with the R package BCEA
-
 Geostatistics for Compositional Data with R
-
 Modeling Dose-Response Microarray Data in Early Drug Development Experiments Using R
-
 Behavioral Research Data Analysis with R
-
 Discrete Choice Analysis with R
-
 R by Example
-
 Semiparametric Regression with R
-
 Heart Rate Variability Analysis with the R package RHRV
-
 Modeling Psychophysical Data in R
-
 Elements of Copula Modeling with R
-
 Modern Optimization with R
-
 Cultural Analytics in R: A Tidy Approach
-
 An Introduction to Web Mining
-
 Numerical Ecology with R
-
 Morphometrics with R
-
 Analysis of Integrated and Cointegrated Time Series with R
-
 Multistate Analysis of Life Histories with R
-
 Computerized Adaptive and Multistage Testing with R
-
 Analyzing Compositional Data with R
-
 Solving Differential Equations in R
-
 Functional and Phylogenetic Ecology in R
-
 Functional Data Analysis with R and MATLAB
-
 Mixture and Hidden Markov Models with R
-
 Singular Spectrum Analysis with R
-
 Retirement Income Recipes in R
-
 Quality Control with R
-
 Analysis of Phylogenetics and Evolution with R
-
 Dynamic Linear Models with R
-
 Applied Survival Analysis Using R
-
 Magnetic Resonance Brain Imaging


“The book is an excellent and very comprehensive manual of … one of the most popular R packages. It is currently the only book describing ggplot2 in such depth. The book contains many examples and is very nicelyillustrated, demonstrating the strength of the package.” (Klaus Galensa, Computing Reviews, May, 2017)
Hadley Wickham is the Chief Scientist at RStudio and a Rice University Associate Professor of Statistics. Hadley is passionate in creating computational and cognitive tools that make data preparation, visualization, and analysis more efficient. Carson Sievert is a PhD student in the Department of Statistics at Iowa State University. He has built 15 R programs and earned the John Chambers Prize for Statistical Computation in 2006 for his work on the ggplot and reshape R packages. R utilities for obtaining data from the Web (pitchRx, bbscrapeR, XML2R), building interactive Web visuals (animint, plotly), and visualizations for analyzing statistical models (LDAvis) are among his accomplishments.
| SKU | Unavailable |
| ISBN 13 | 9783319242750 |
| ISBN 10 | 331924275X |
| Title | ggplot2 |
| Author | Hadley Wickham |
| Series | Use R! |
| Condition | Unavailable |
| Binding Type | Paperback |
| Publisher | Springer International Publishing AG |
| Year published | 2016-06-16 |
| Number of pages | 260 |
| Cover note | Book picture is for illustrative purposes only, actual binding, cover or edition may vary. |
| Note | Unavailable |